
Special Edition, a deep dive on Jesse Winker’s stats:

Special Edition, a deep dive on Jesse Winker’s stats:
This is my 1st special edition, even better, this is a reader requested piece! If you want my thought’s on a specific player or baseball topic, feel free to ask!
I’m going to be including some images from Baseball Savant, they use Statcast to generate their data. It’s really a great website for us stat nerds, I hope the addition of the images is well received. I always appreciate feedback, good or constructively critical.
So Dakota, a friend on twitter, and I were discussing a few Mariners topics the other day. KLew and his rehab; the game itself; and eventually Jesse Winker was brought up. We wanted to try to understand why his stats, thus far, seem so different here in Seattle vs when he was with the Reds. Great topic and I accepted the challenge of trying to make sense of it. To be honest, we had a suspicion that the differences could possibly have something to do with the change from Cincinnati to Seattle. I was surprised that, as it turns out, this is not the case.
For those who just want the summary, here ya go: Jesse Winker will be fine. He is making some batting adjustments, which add to his typical slower start to any given season. The ballparks in Cincy and Seattle, well, both have similar xwBA for Jesse, especially line up in xHomeRuns. (xw: eXpected Weighted, basically, well “expected” is obvious, meaning the expected/anticipated stat based on the situation. Weighted means adjusted for variables such as ballpark etc).
*A quick note of caution, I am no expert. I am presenting how I understand the data.
*Also note, I am relying on xw stats as it’s early in the season, but also comparing actual stats as they are done in percentages. Due to using both, take this with a grain of salt, xw stats give us an idea only, best used to give a comparison as opposed to definitive.
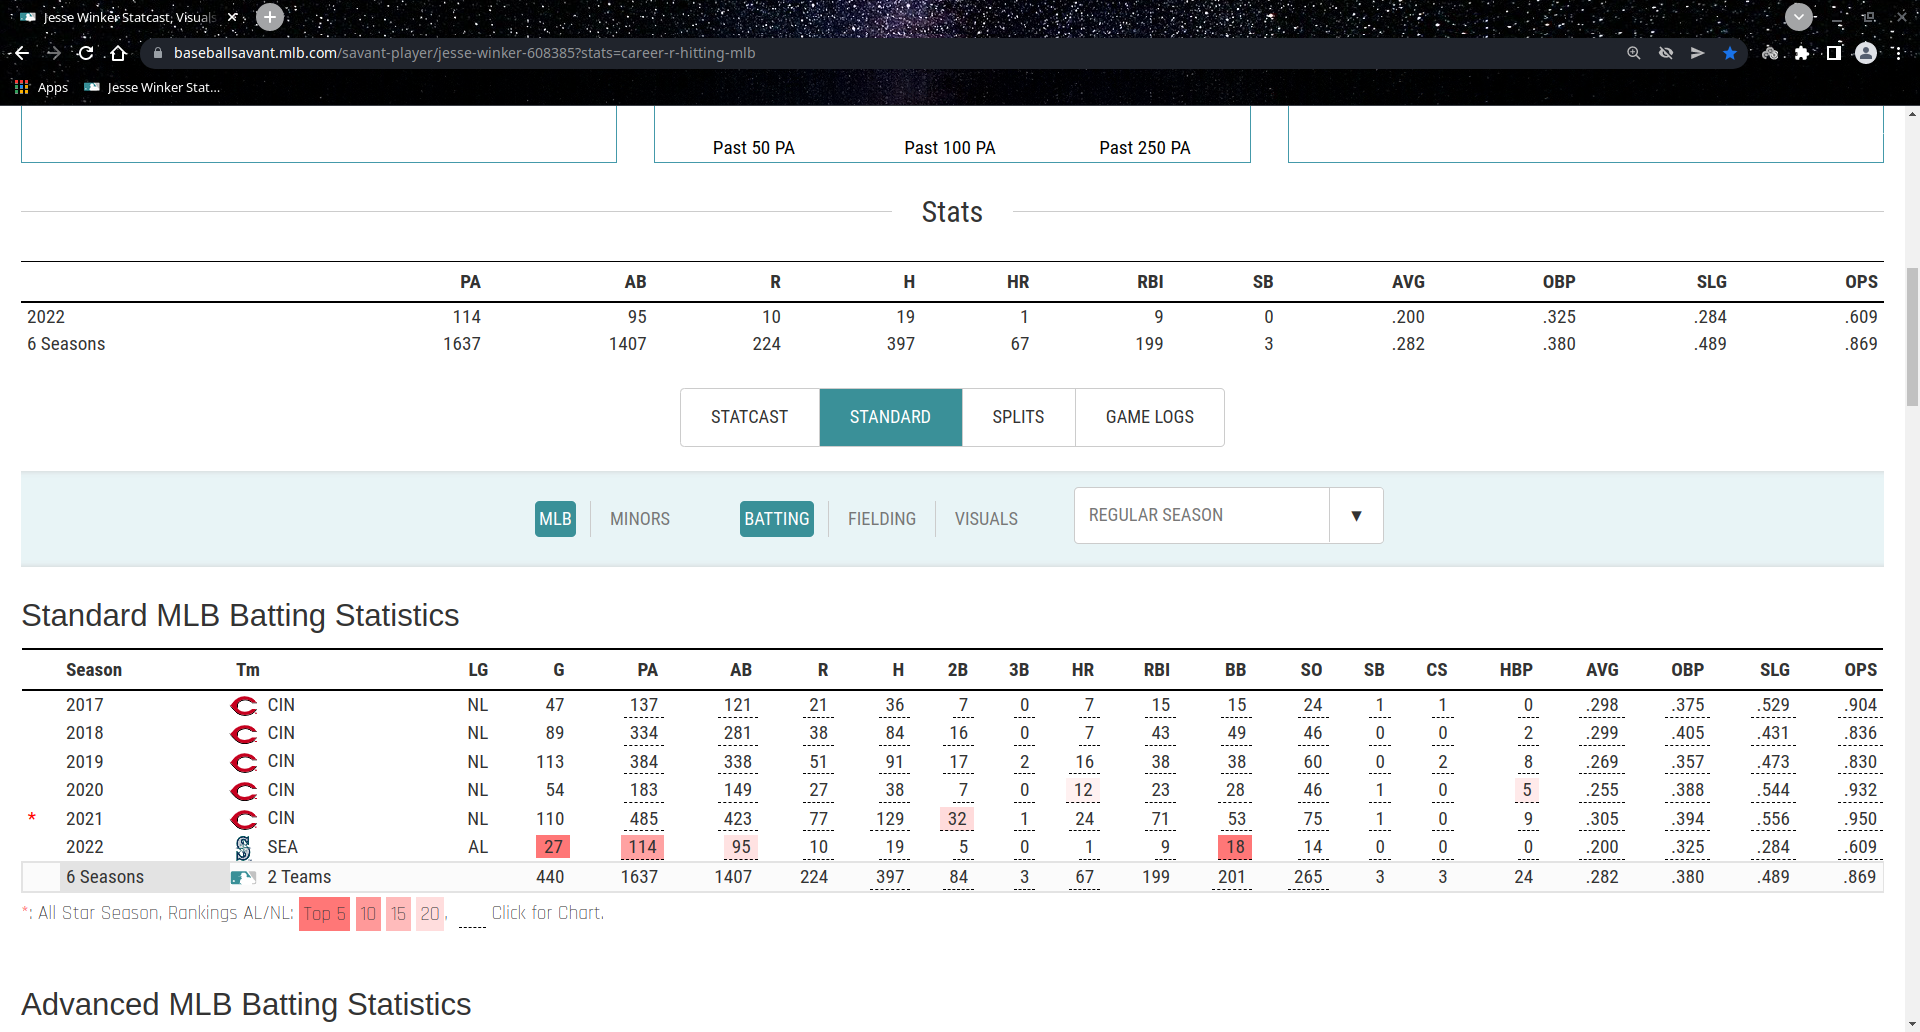
As of today, May 6, 2022, Jesse Winker is batting .189. His OPS (On base Plus Slugging, basically on base hits AND extra base hits but excluding walks) is .577 (OPS is a better indicator than OBP, On Base Percentage). His worst batting average (BA) year was the shortened season of 2020 when he hit .255. His best season thus far is 2021, in Cincinnati, when his BA was .305 with an OPS of .950. His xwBA for the same 3 years are as follows: 2020 xwBA .397; 2021 xwBA .390; and 2022 (so far) xwBA .402. As you can see, xw stats aren’t necessarily close to actual stats, there is a pattern though. Over his 6 seasons, his xwBA went up, down, up, down, up, down and now up. The actual BA went up, up, down, down, up then this year. (I didn’t include the numbers, the up/down is
the direction the final stat was vs the year previous)
I’ve attached a screenshot from Baseball Savant that shows the chart I just referenced.
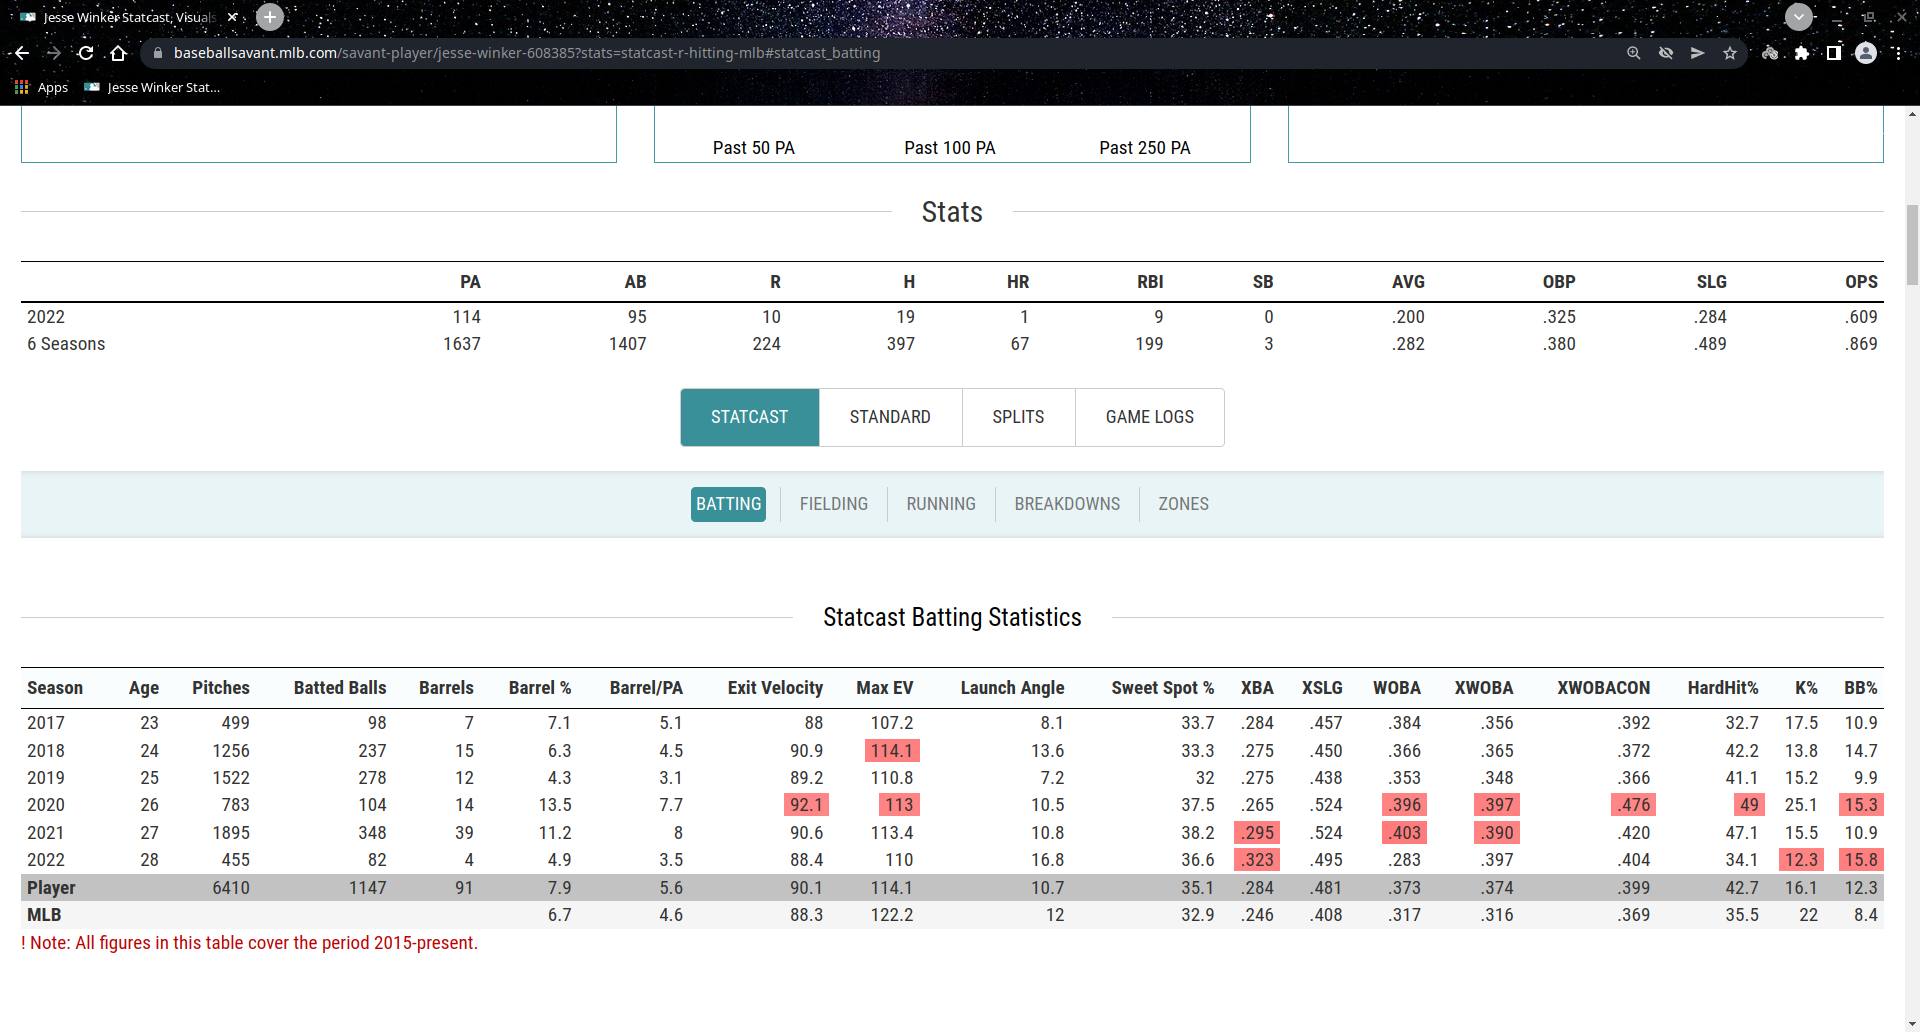
So what does this tell us? That Jesse Winker has an apparent pattern to his hitting per year. Assuming the pattern holds, his overall actual BA this season should be good. I don’t see a reason for this pattern, nor do I see any reason it shouldn’t hold true for this year. The picture below shows the pattern.
Let’s touch on why I said I don’t see a reason for the pattern to not hold true. It’d be easy to assume there would be a difference due to changing home ballparks. That makes sense right, ballparks are made with different dimensions (distance from home plate to the outfield wall, a main reason for using Weighted averages, to compensate for said differences.) and a change in home ballpark environment. Yet looking at the xw averages, can see the difference between Seattle and Cincinnati is in fact, negligible. As you can see below, his xw (again, eXpected Weighted) Home Run numbers are similar between Seattle and Cinncy.
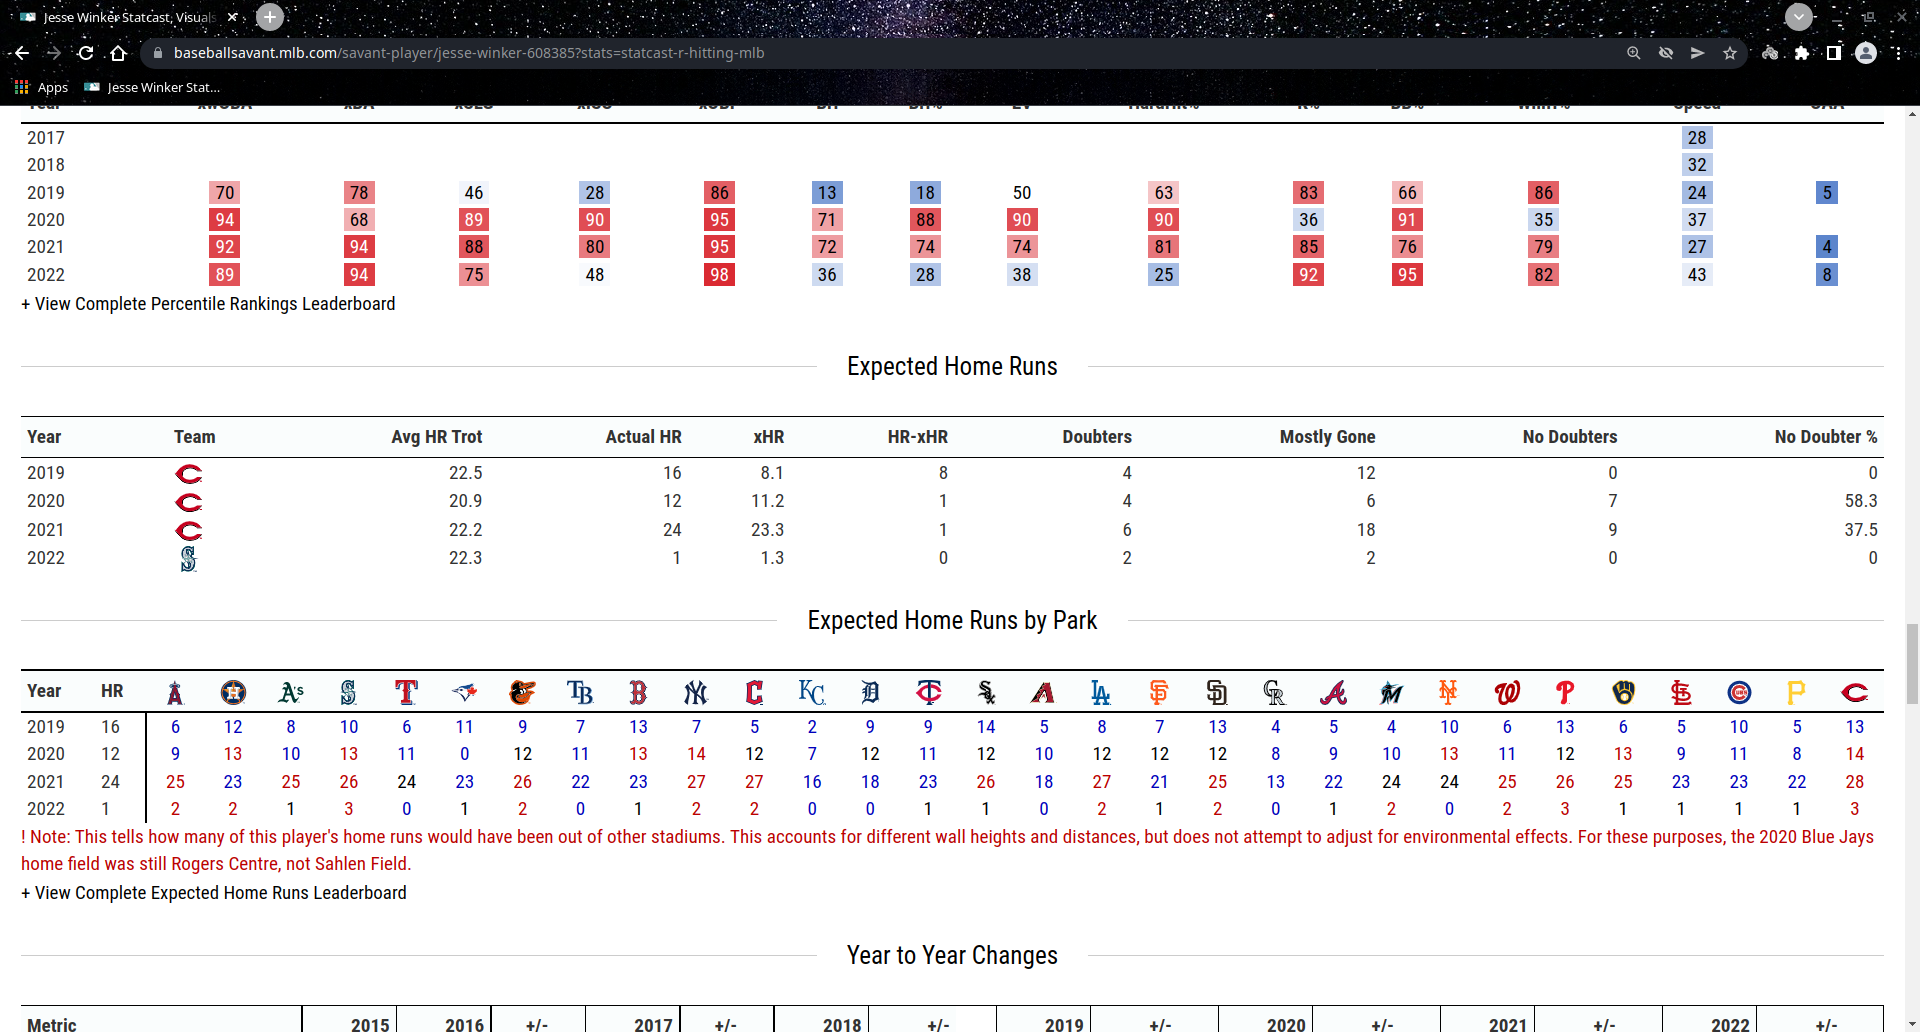
So that is the surprising part, the fact of no real differences between here in Seattle and in Cincinnati. The pattern is something to give us hope, we could conclude that it’s just a slow start for him, as has been in years past.
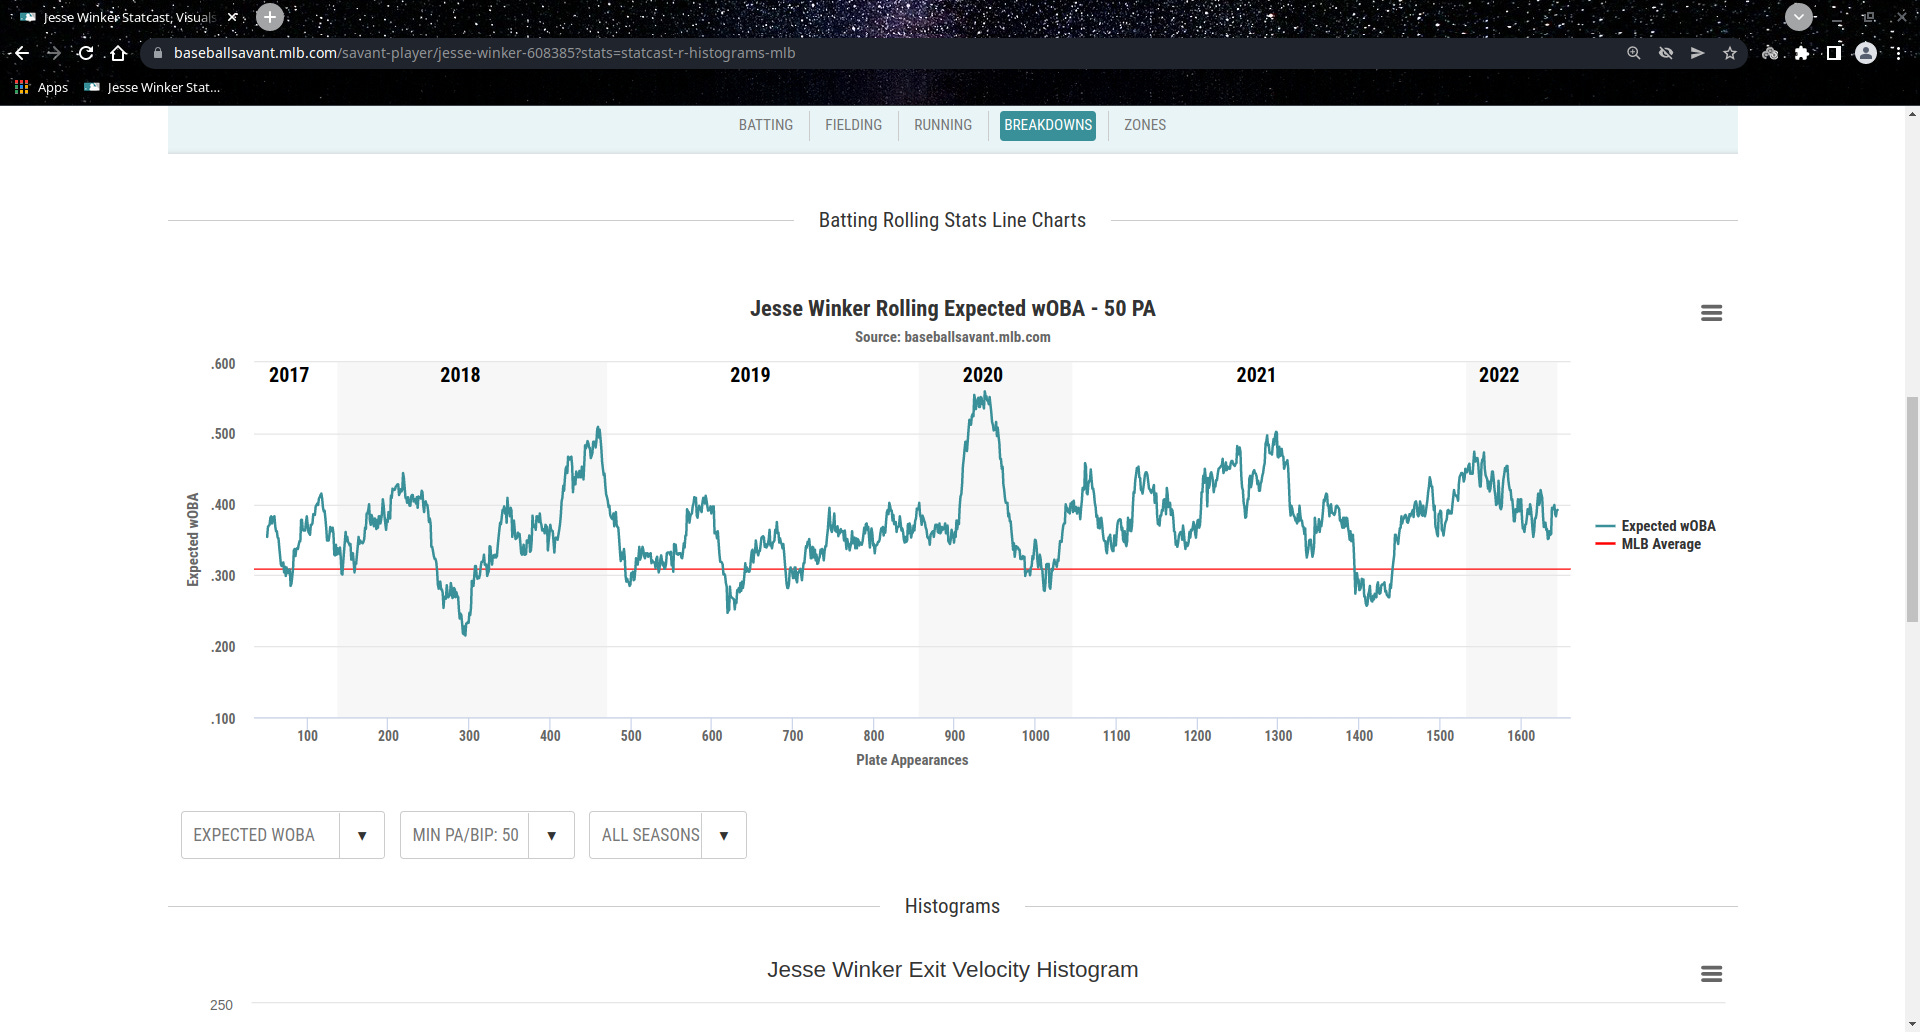
The below image shows his rolling averages, you can see the line never starts “high” and if you average the line (it’s not averaged in the image) that he is actually doing about as should be expected right now.
One last thing I want to touch on, and for sake of article length I won’t include images, is Winker’s batting adjustments, 2 aspects actually (which would require 4 plus images). If you imagine a 3 by 3 grid over home plate, Winker is now hitting more pitches middle/middle and middle/away (away being over the outside portion of the plate, so far right from a pitchers view). The number has jumped a few percentage points for hits in those 2 squares.
The other adjustment is easier to see, if you divide the ballpark in to 5 slices of pizza, for the previous years you see that many of his hits for towards right field. That is to be expected for a left hand hitter. This year though, so far, hits towards the middle slices are increasing. He’s still hitting to right field a good amount of time but his hits down the middle are increasing. This suggests to me that he is working on spreading his hits out more evenly, an example being his 1st home run at T-Mobile Park on May 5th. It was to center field, showing his increasing power up the middle. In the long run, this will make him a much better hitter, so long as he keeps at making the adjustments.
To summarize, I think some of us were worrying about nothing. This deep dive made me feel a lot better about Jesse Winker as a hitter. I didn’t know he had slow starts, didn’t know there was a pattern to his xwBA and actual BA, didn’t know his hits down the middle were on an upswing.
I know this is a lot of data to digest, I hope the images and explanations simplified it for you. You can always comment on these articles, with questions etc. You can also find me on twitter at @sanjaromin to discuss matters, either on my main timeline or in our Mariners Fan Zone Community.